
At OceanStream we believe that ocean observation can be made more efficient and reliable by using technologies like edge computing for data collection and processing. The main gaps at the moment are efficient workflows and routines which bring scalable data processing close to the physical instruments in the field that are actually collecting the measurements.
Earlier this year we conducted a field test of our edge-to-cloud platform on the OceanLab Munkholmen buoy in the Trondheim Fjord, in a collaboration with SINTEF Ocean. This was the first proper field campaign where we deployed and verified our ocean observation solution, integrated on a real ocean environment. We have chosen a ruggedised Edge AI computer, powered by a NVIDIA Jetson Orin NX 16GB module and built by a company in Switzerland called Syslogic. It was connected to the local network and able to stream and process the raw data from the marine instruments in real-time.
Objectives
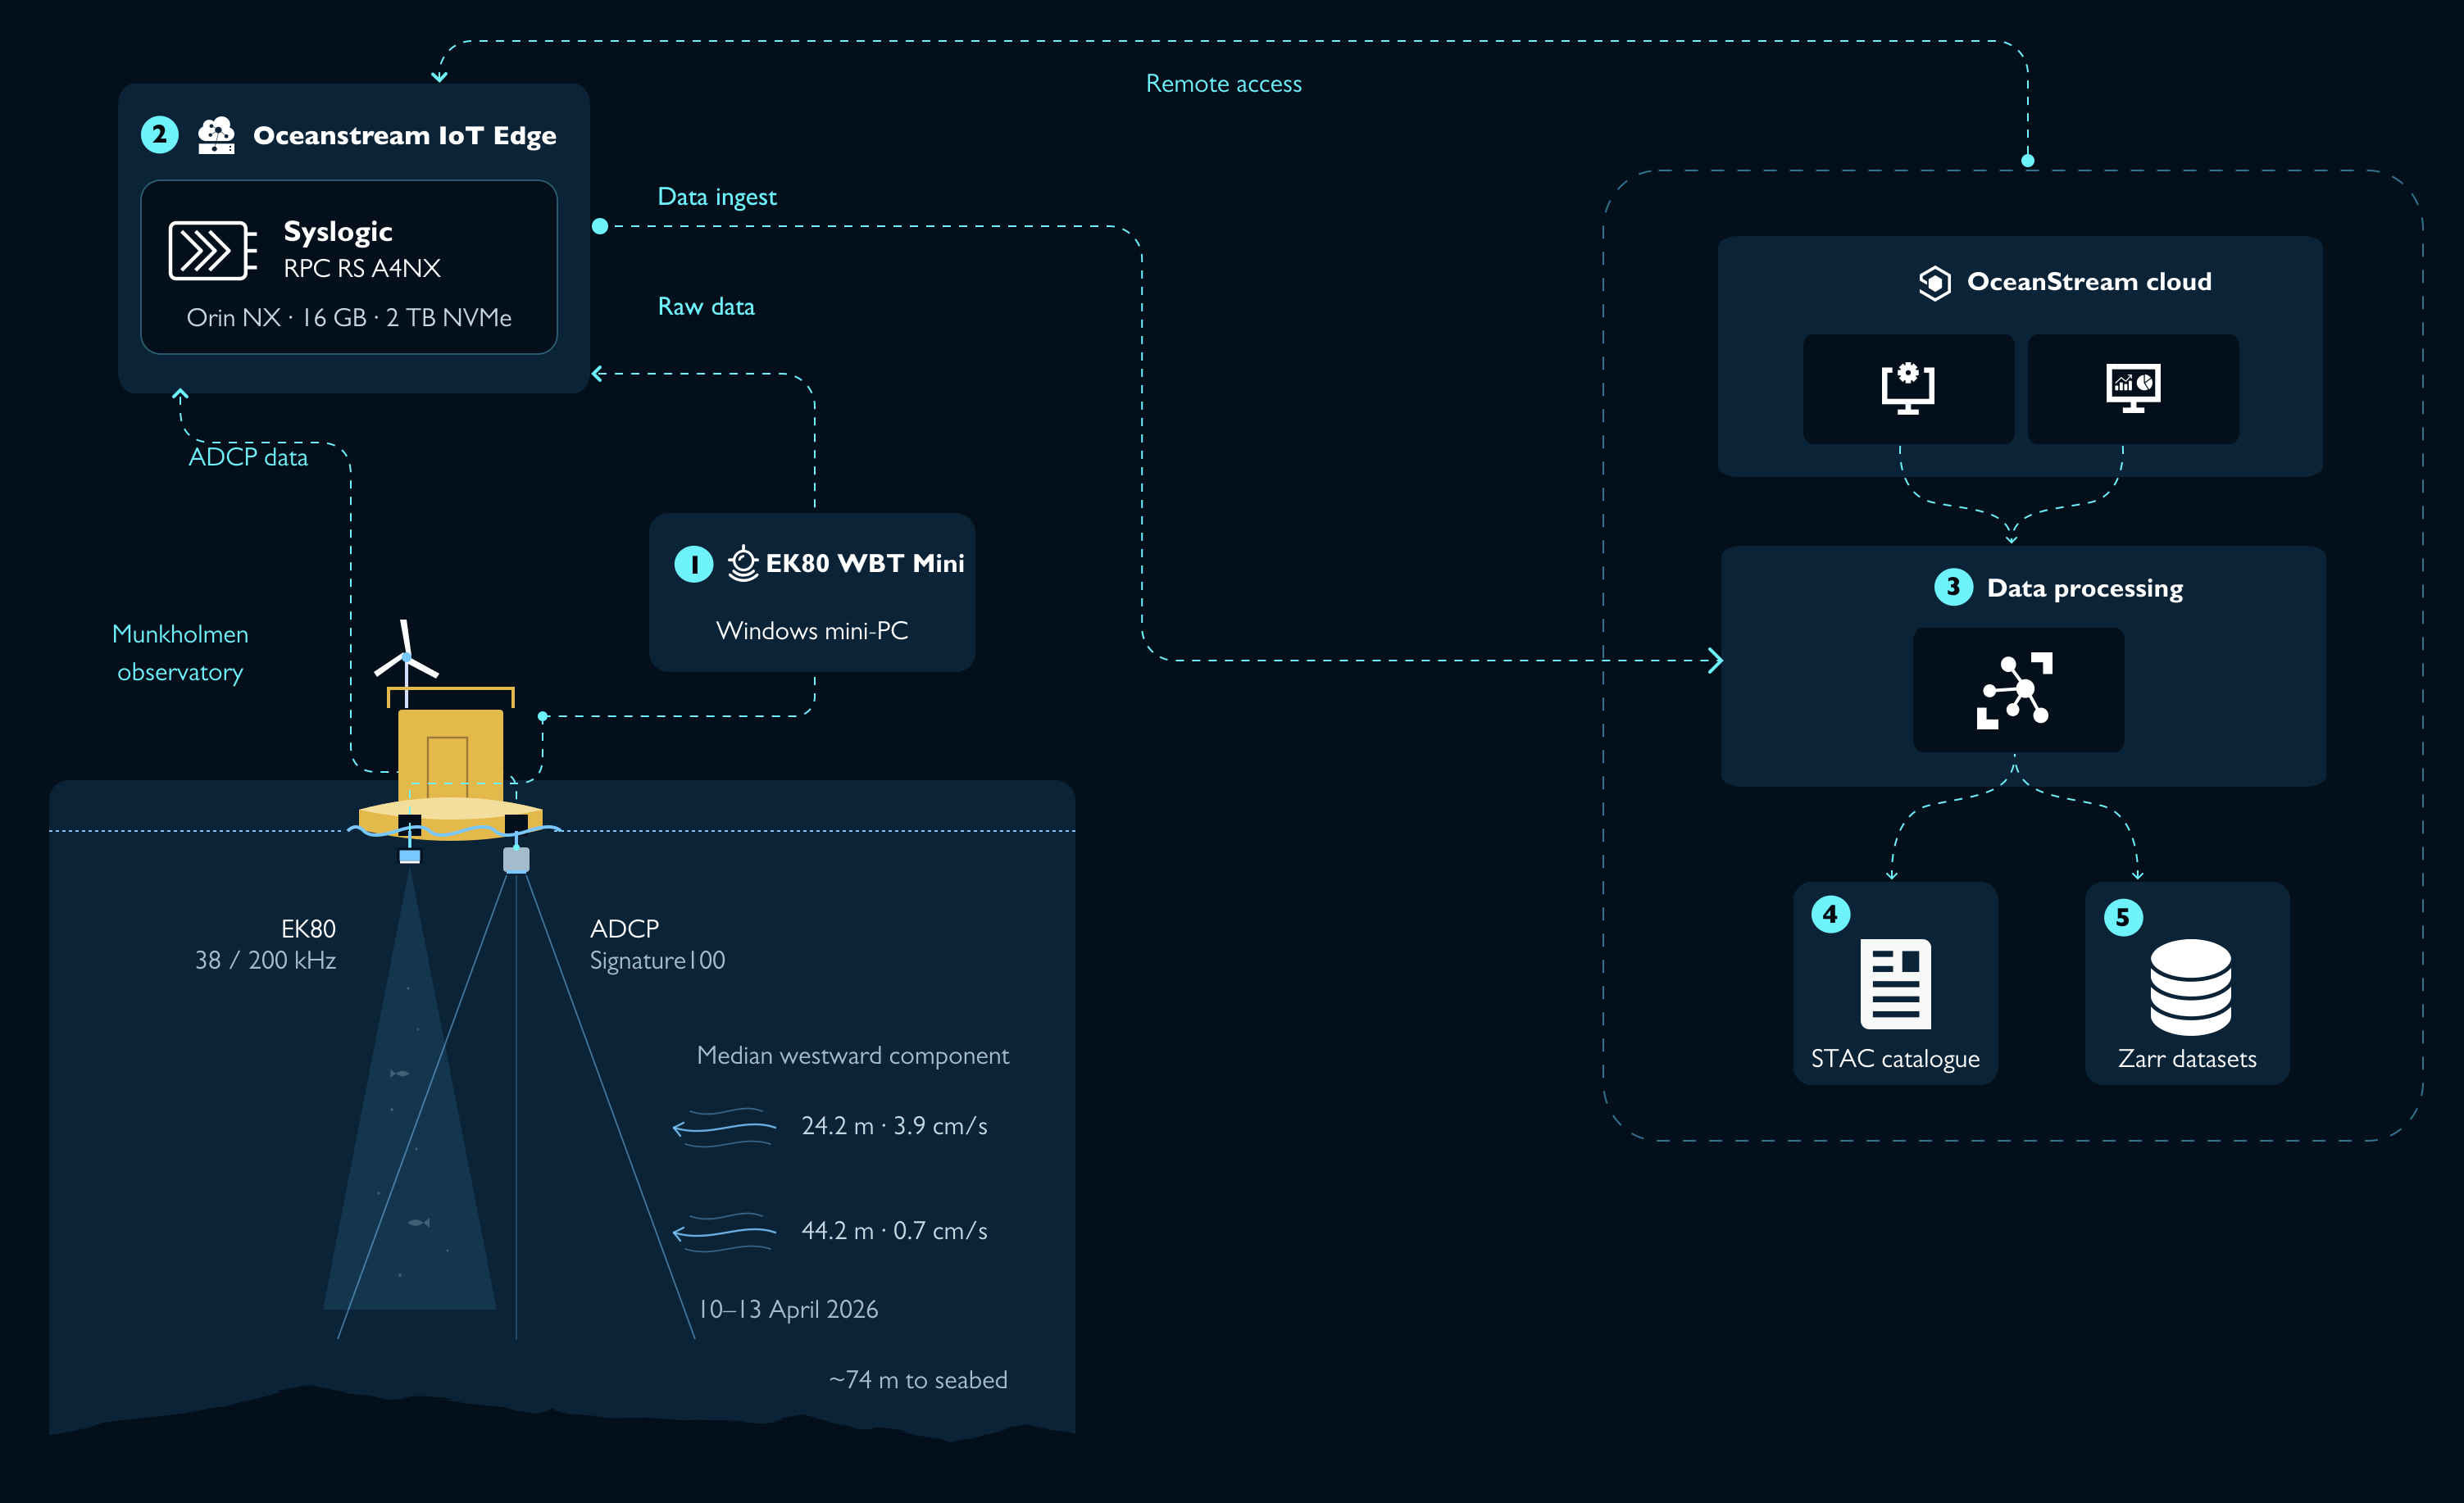
OceanStream provides an integrated solution so that raw data from oceanographic instruments is collected and transformed into analysis ready and cloud optimised (ARCO) datasets seamlessly and efficiently. Data is streamed, transformed, and harmonised from multiple sensors and formats, using open-source libraries, and directly at the edge – i.e. on the OceanLab observatory.
Automated processes and quality checks on the edge device also ensure that relevant metrics and data summaries are uploaded to the cloud when the internet connection is stable – Trondheim Fjord has good 5G coverage so here this isn't a problem.
According to the Intergovernmental Oceanographic Commission of UNESCO (IOC), "much of the ocean is still a blind spot"[1], while every weather forecast, climate projection and tsunami warning depends on ocean data. OceanStream's mission is to work towards closing this gap, and this project is one concrete step ahead.
A floating marine laboratory
The Munkholmen buoy is a world class floating laboratory. The platform is 5.2 metres in diameter and rises about five metres above the sea surface; SINTEF describes it as weighing ten tonnes. Three anchors secure it at a site with a nominal depth of about 80 metres. In April, the EK80 echosounder measured roughly 74 metres from its transducer to the seabed.
It has four moonpools, an autonomous profiling winch for moving sensors through the water column, and mounting points on its side and roof. Visiting instruments can use the buoy's power and telemetry, with the site about 20 minutes from Trondheim by small boat in good weather. This arrangement gave the EK80 a place beside established environmental sensors, with access from shore when the installation needed attention.
Experimental setup
Our project deployed a Simrad EK80 WBT Mini, loaned by NTNU's AUR-Lab with a 38/200 kHz dual-transducer, in one of the buoy's moonpools. We also deployed the Syslogic edge device and connected it to the local network in the buoy, and collected data between 10-14 April, 2026, from the echosounder and 2 other sensors which were already installed: a Nortek Signature100 ADCP (acoustic Doppler current profiler), and a Sea-Bird SBE19plus CTD (conductivity-temperature-depth).
The EK80 echosounder sends short sound pulses into the water column and listens for echoes, then it records the echo strength, which helps researchers investigate biological activity, identify species, and estimate marine biomass and abundance. The ADCP measures how fast water moves, and in which direction, at different depths. It has four angled beams which measure horizontal currents and a separate vertical beam for an echosounder. The CTD measures how easily seawater carries an electrical current, its temperature and the surrounding pressure, measuring salinity and an estimate of depth. Temperature and salinity help identify changes in the water and calculate how sound travels through it.
Installing the echosounder
After bench testing the echosounder and fitting in the connectors to the edge device in the lab at the SeaLab in Trondheim (the building housing both SINTEF Ocean and the NTNU SeaLab center) the day before, we proceeded to the buoy location on the morning of April 9th, 2026, via workboat with Ralph and Lukas from SINTEF.
The team installed the transducer in the buoy's moonpool, looking down into the fjord, and fitted the Syslogic edge device into the instrument cabinet, where computers and their cabling are located. The installation went according to plan, except for a very stubborn fuel cell tank, which wasn't giving in to be open. Each of us took turns trying to manually unscrew the top, but what actually worked was using a short piece of rope with a few knots, which Ralph was able to produce and use effectively.
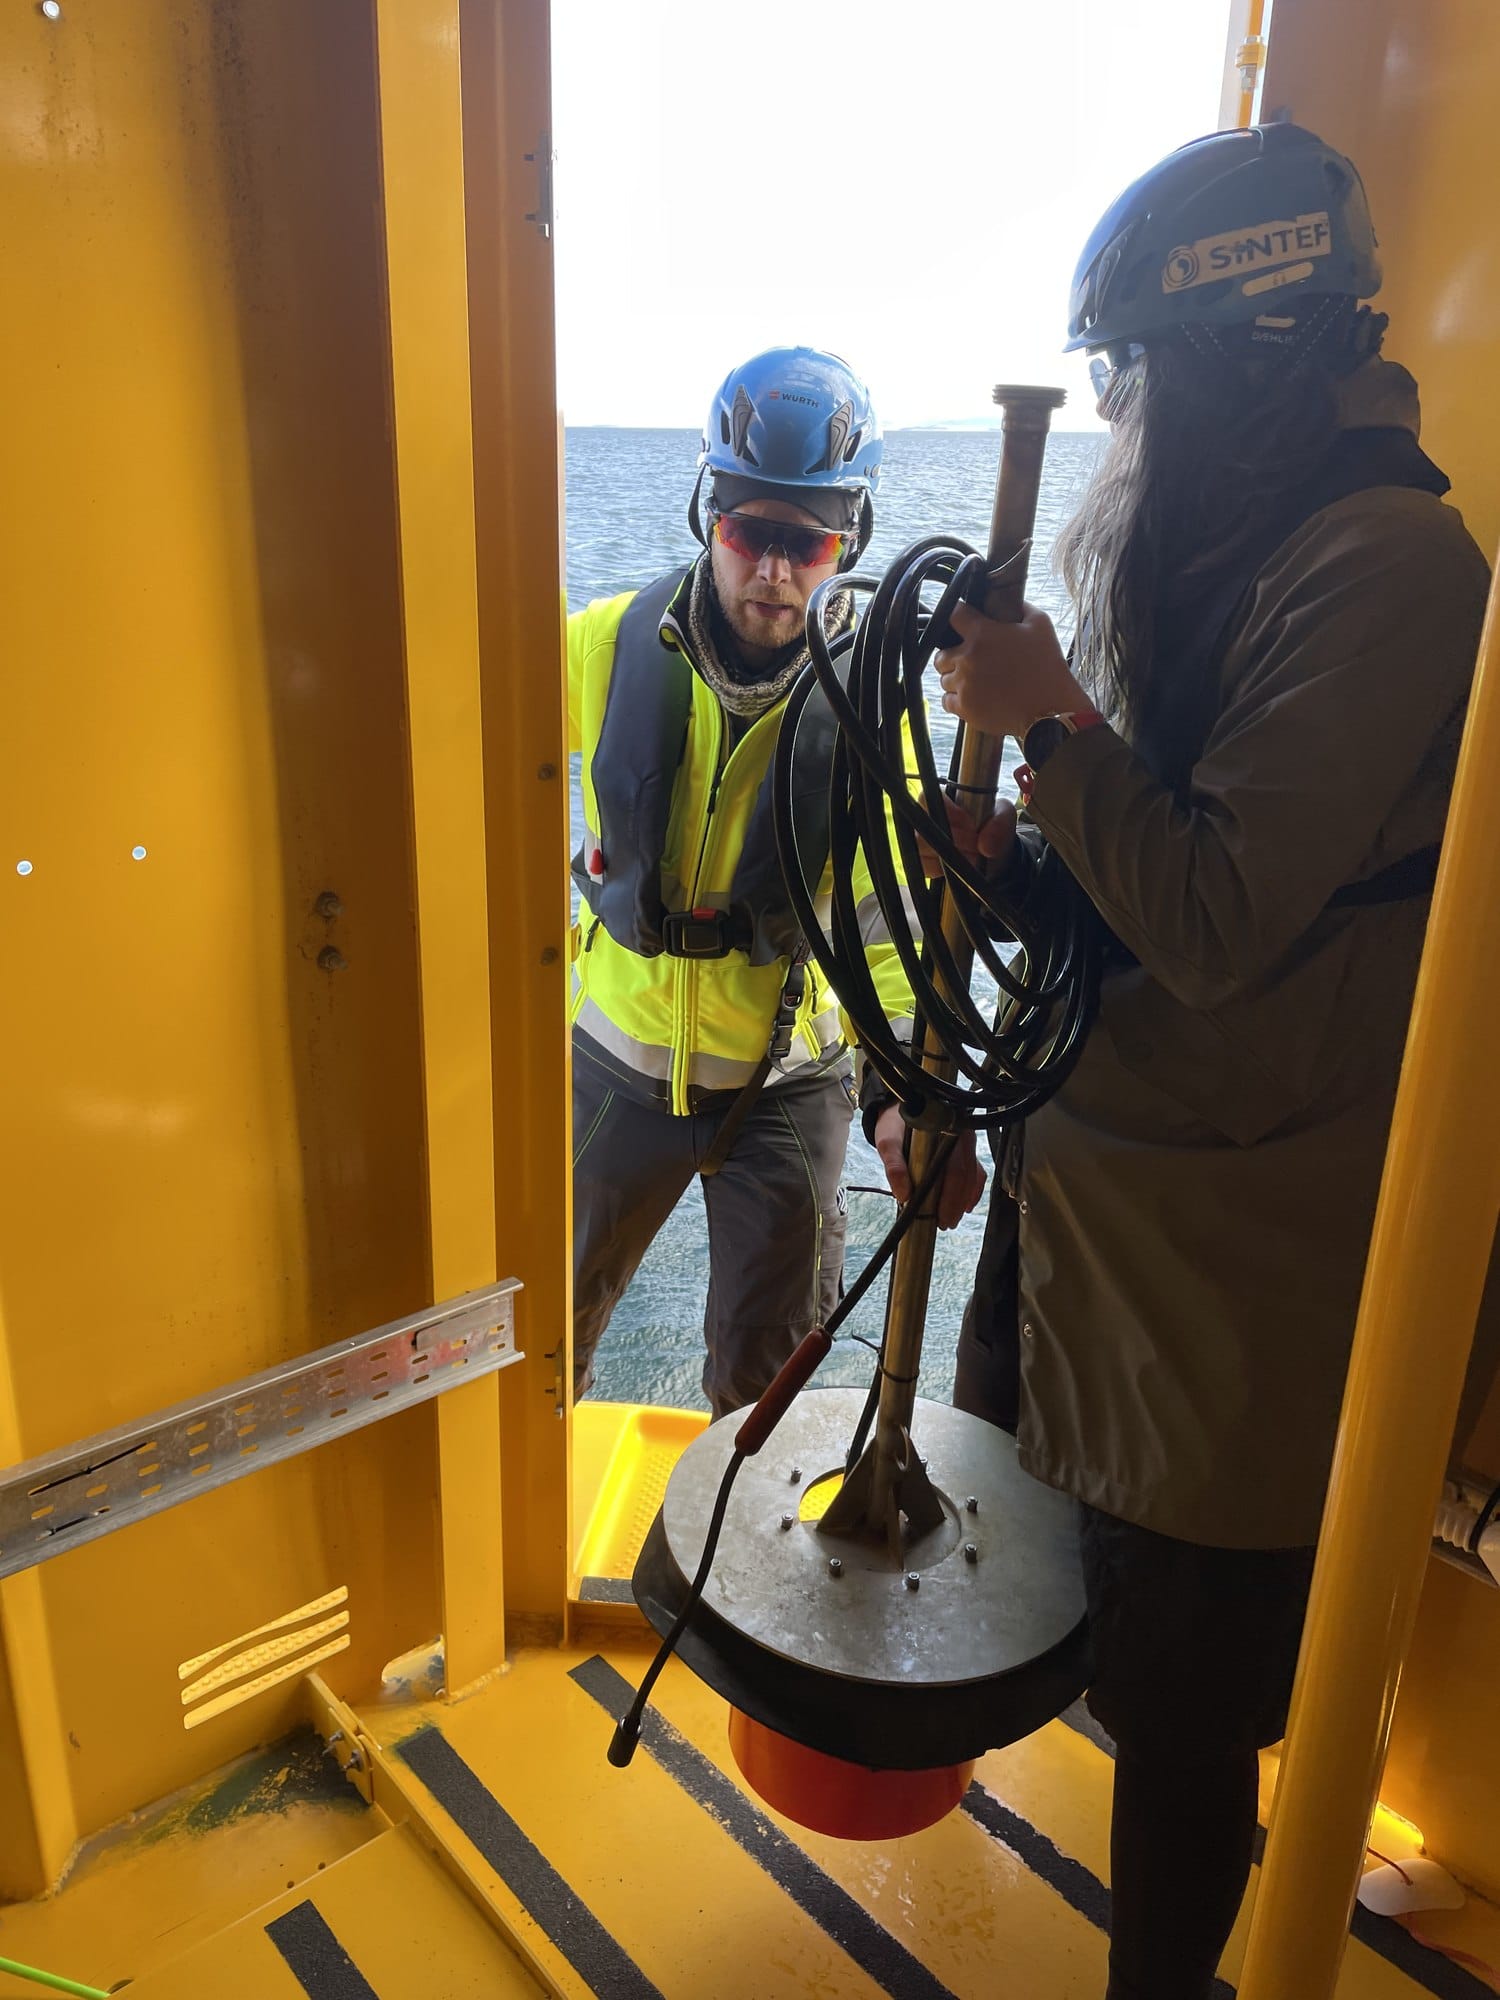
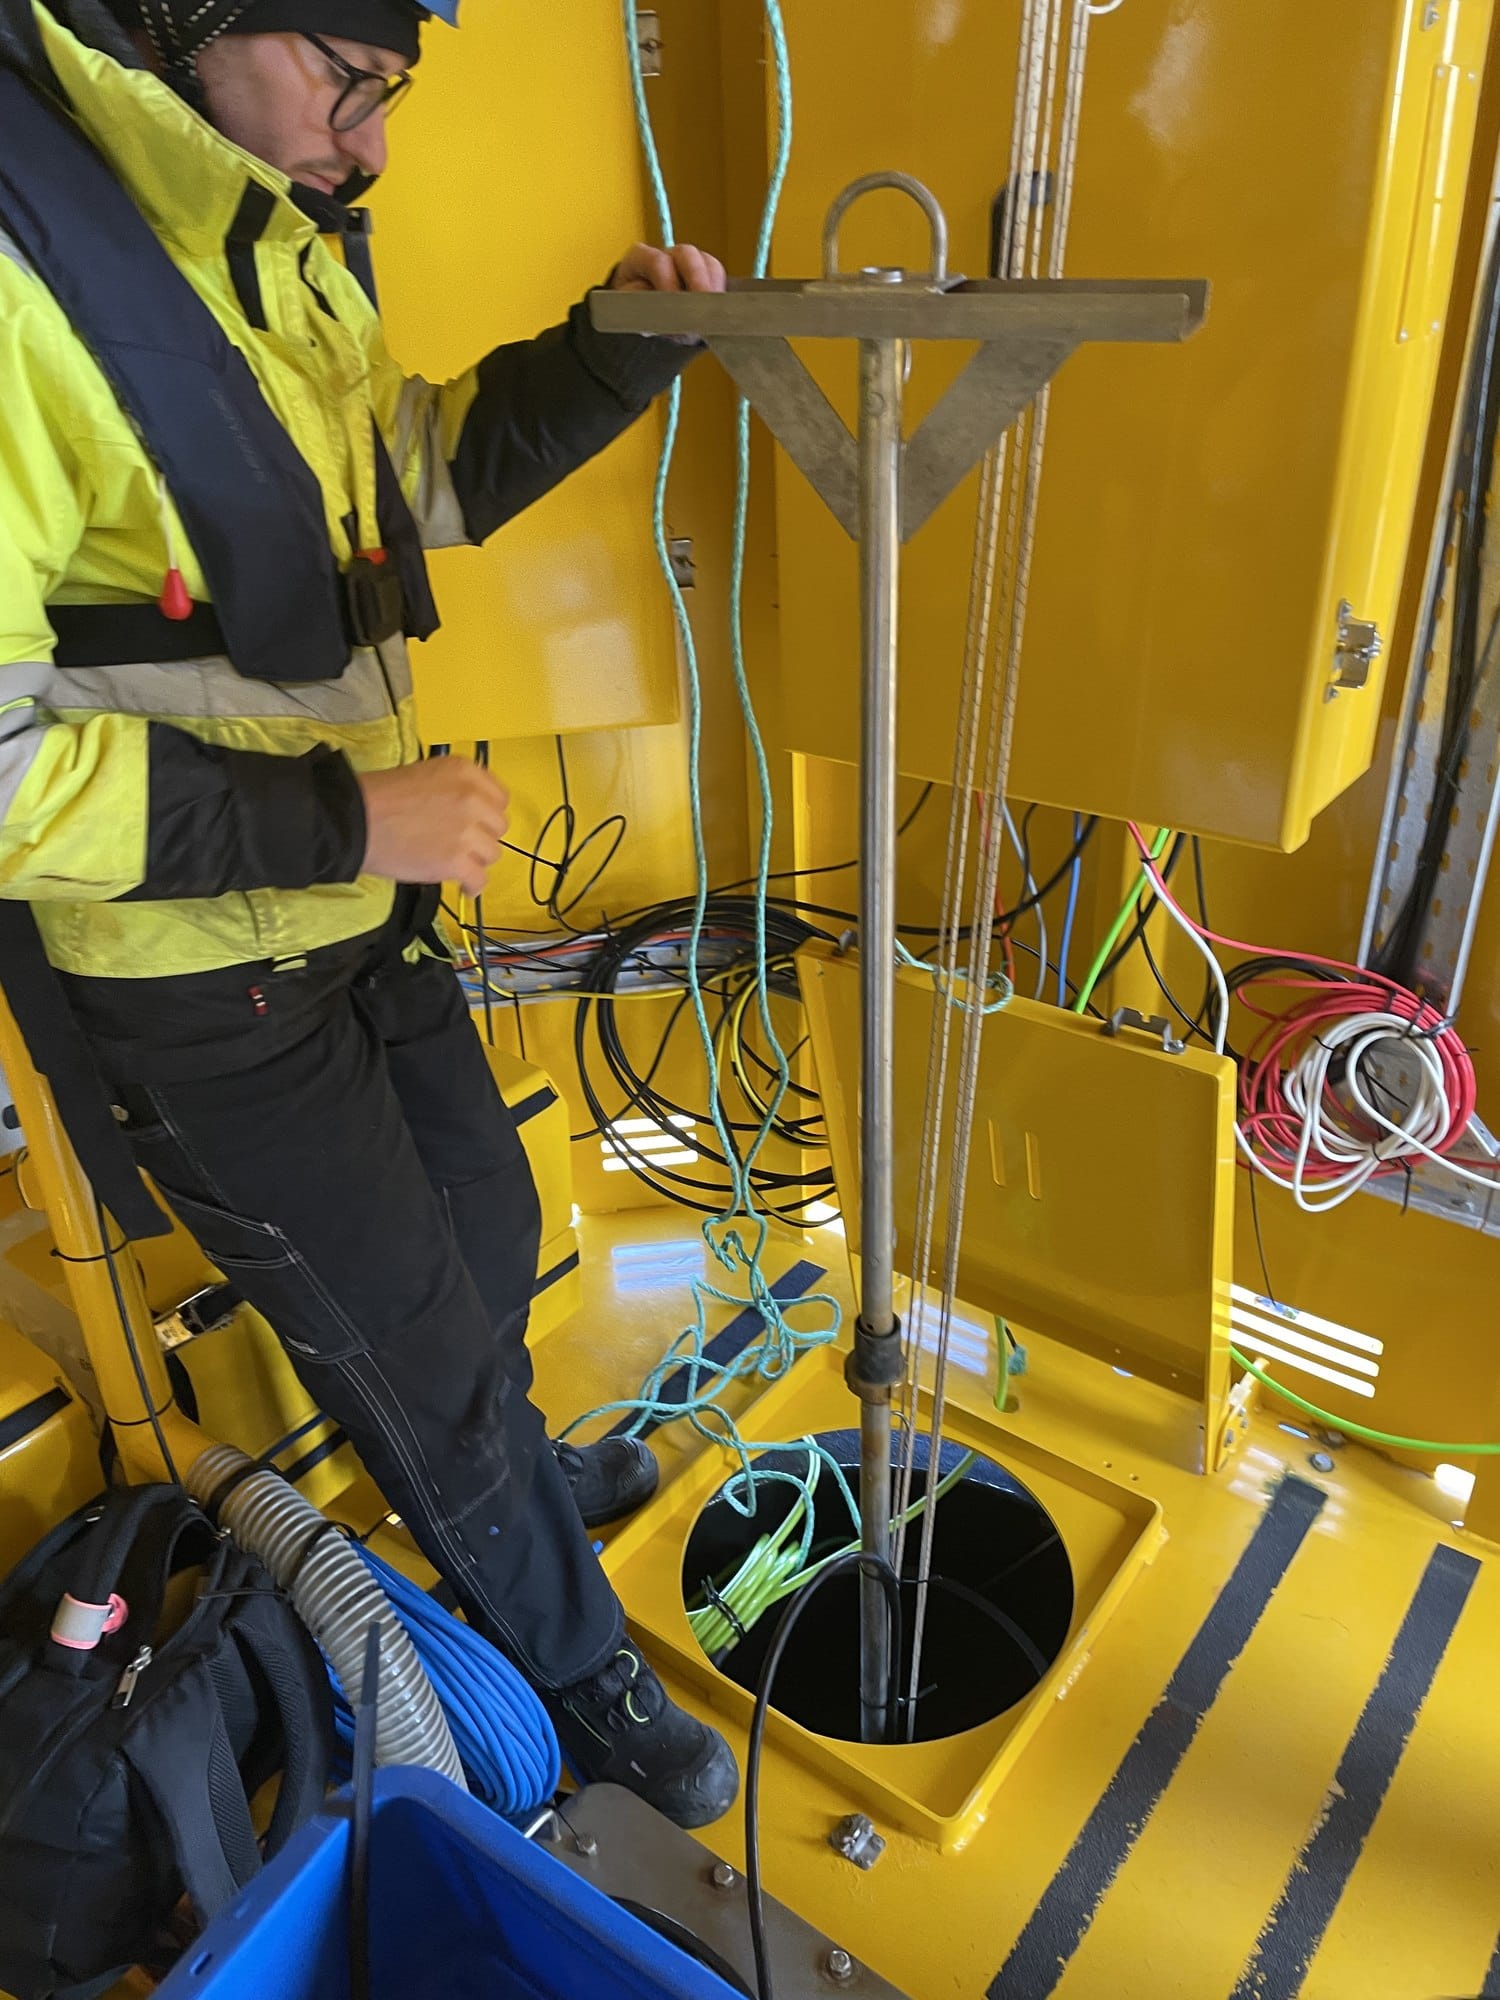
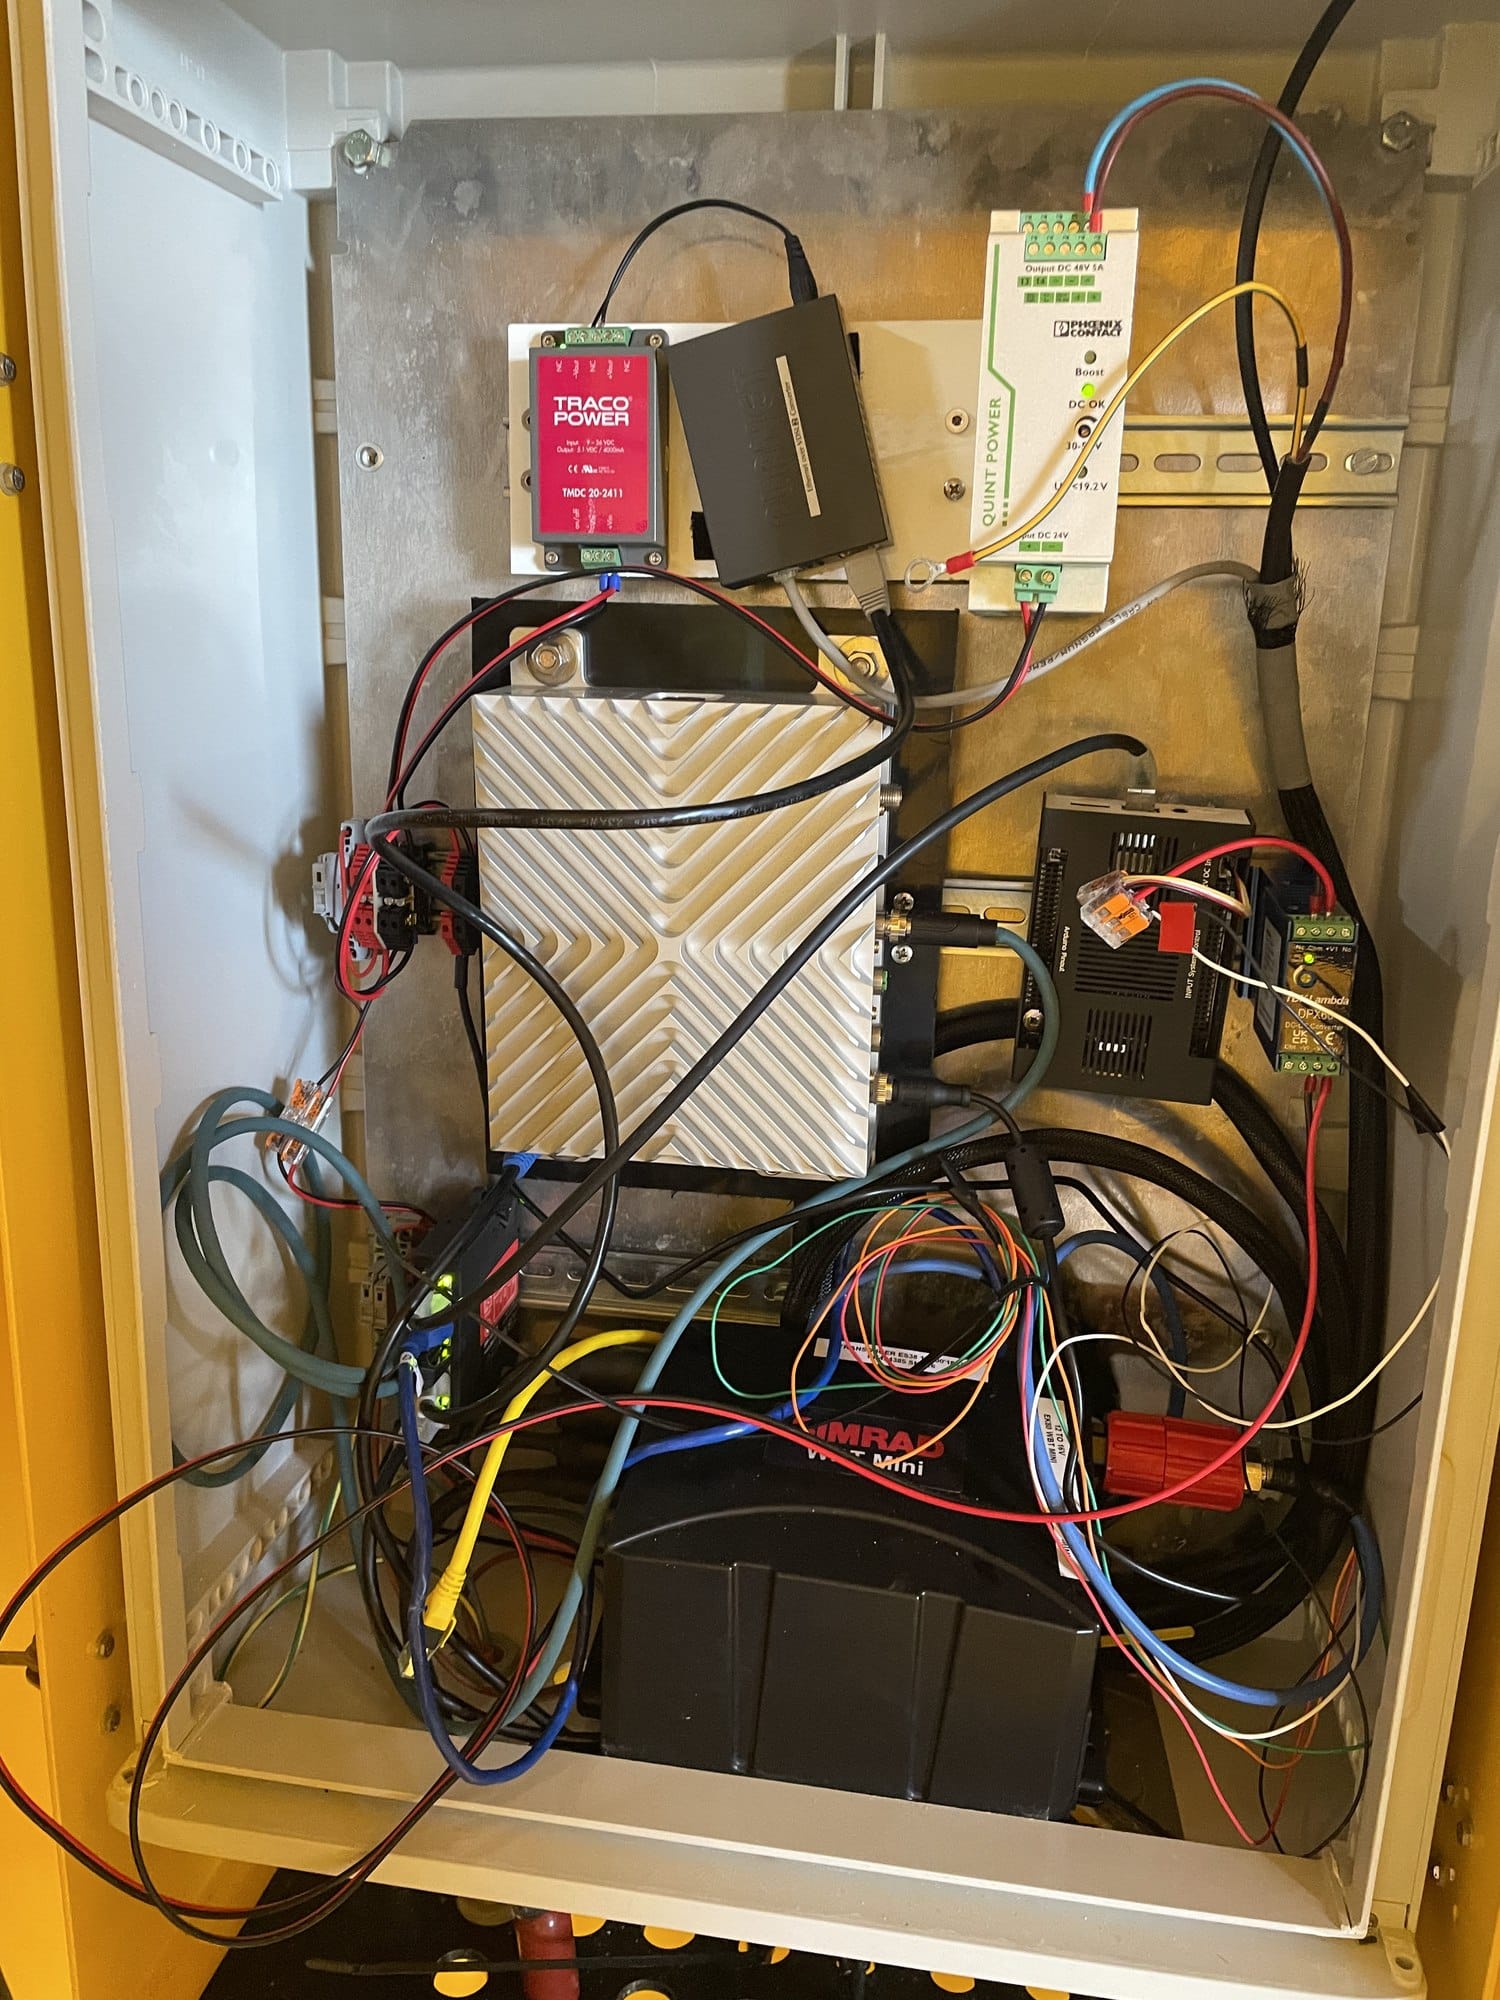
The team is carrying and installing the echosounder transducer and the edge device in the cabinet
Reading the echoes
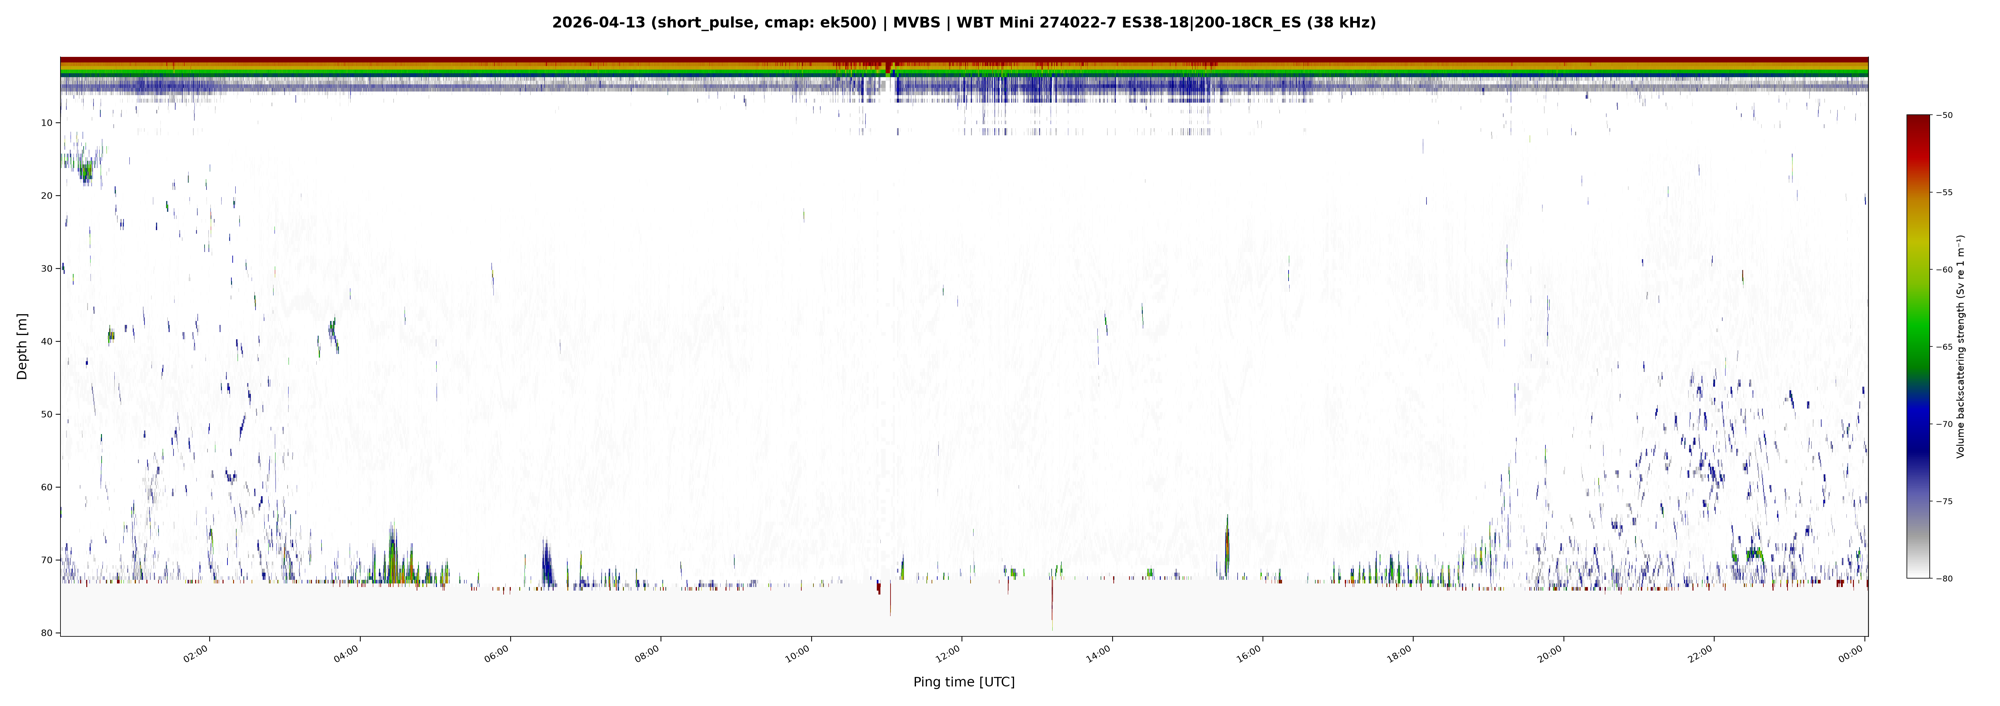
The echogram is a 2D visualisation of the acoustic returns by time and depth. Colour represents backscattering strength: the intensity of sound returned from a volume of water and a bright mark can come from an organism, the seabed or interference.
The echosounder operated with a dual 38/200 kHz frequency transducer, and the 38 kHz channel provided the more usable view through the water column. After processing, 88% of the 38 kHz time–depth cells above the seabed retained data. Each cell represents a 10-second interval and a 0.5-metre depth range.
The data recorded on the 200 kHz channel, on the other hand, looks a lot more noisy. Its noise floor changes by about 10 dB over minutes: 99% of MVBS cells retain data between 1 and 10 metres, falling to 34% between 10 and 30 metres and 7% below 30 metres. Diagonal streaks and vertical stripes remain evidence of interference whose source its not identified, but if I would have to guess I'd say that it's impulse noise from the ADCP, which was diligently doing its work nearby.
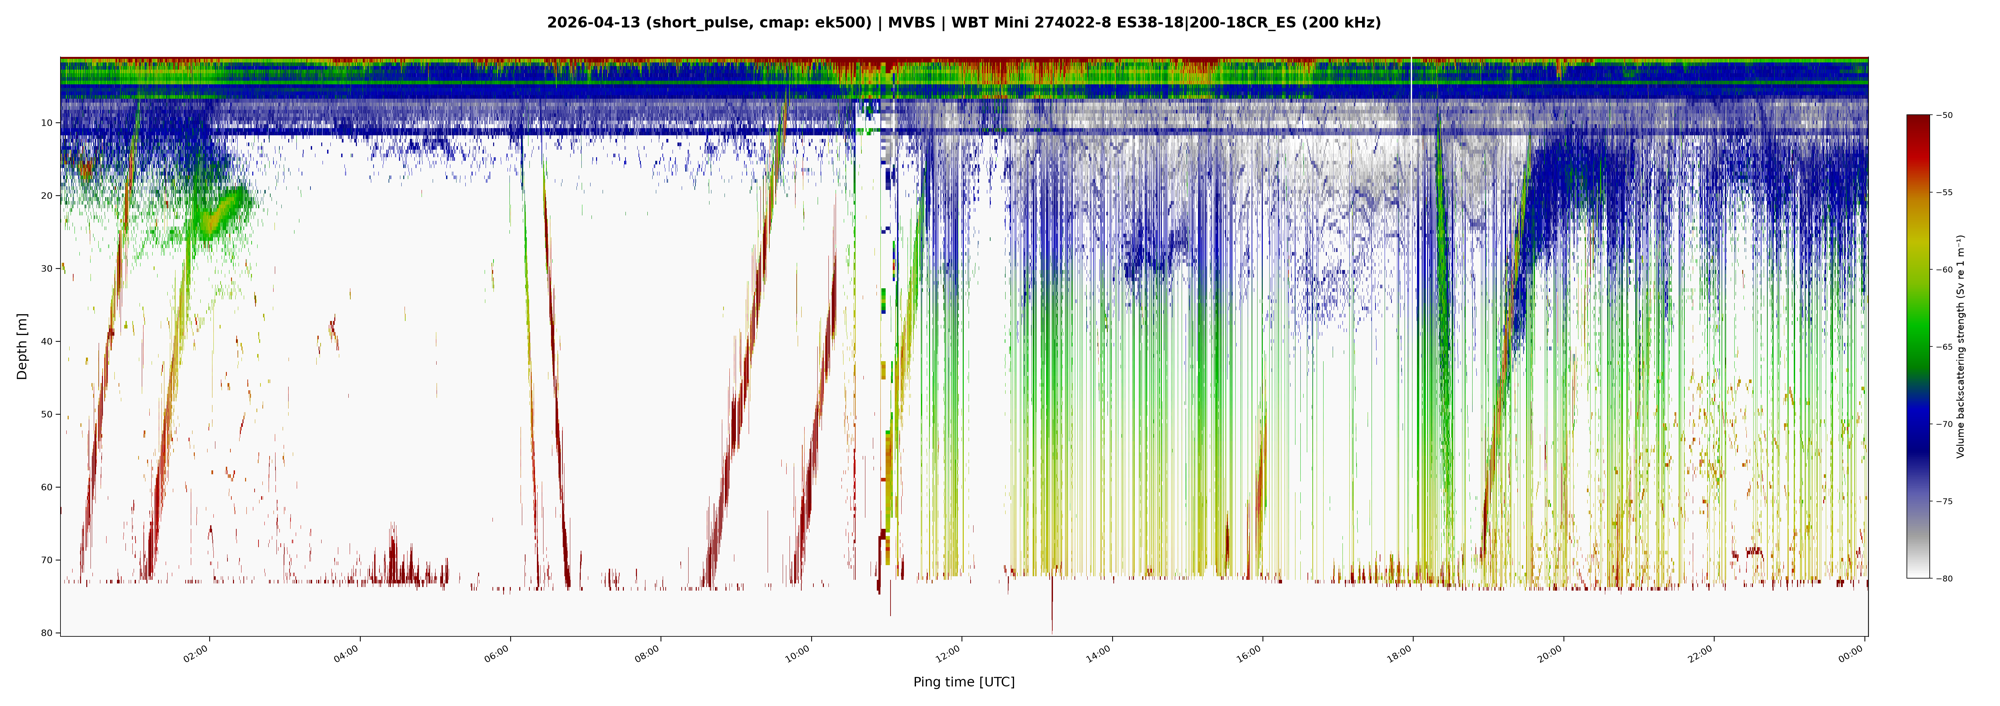
The backscatter values also carry calibration uncertainty: since this was more of a technology integration test, the EK80 used factory gains and had no reference-sphere calibration, leaving uncertainty in absolute backscatter levels. There were also several problems regarding the power supply to the echosounder transceiver, but the SINTEF team was able to address in a follow-up boat trip.
Currents and surface water conditions
Comparing the echoes with the currents gives the record a physical context. The seabed also provides a useful reference and during the deployment its detected range varied from 72.7 to 74.6 metres, which we can attribute to the tide.
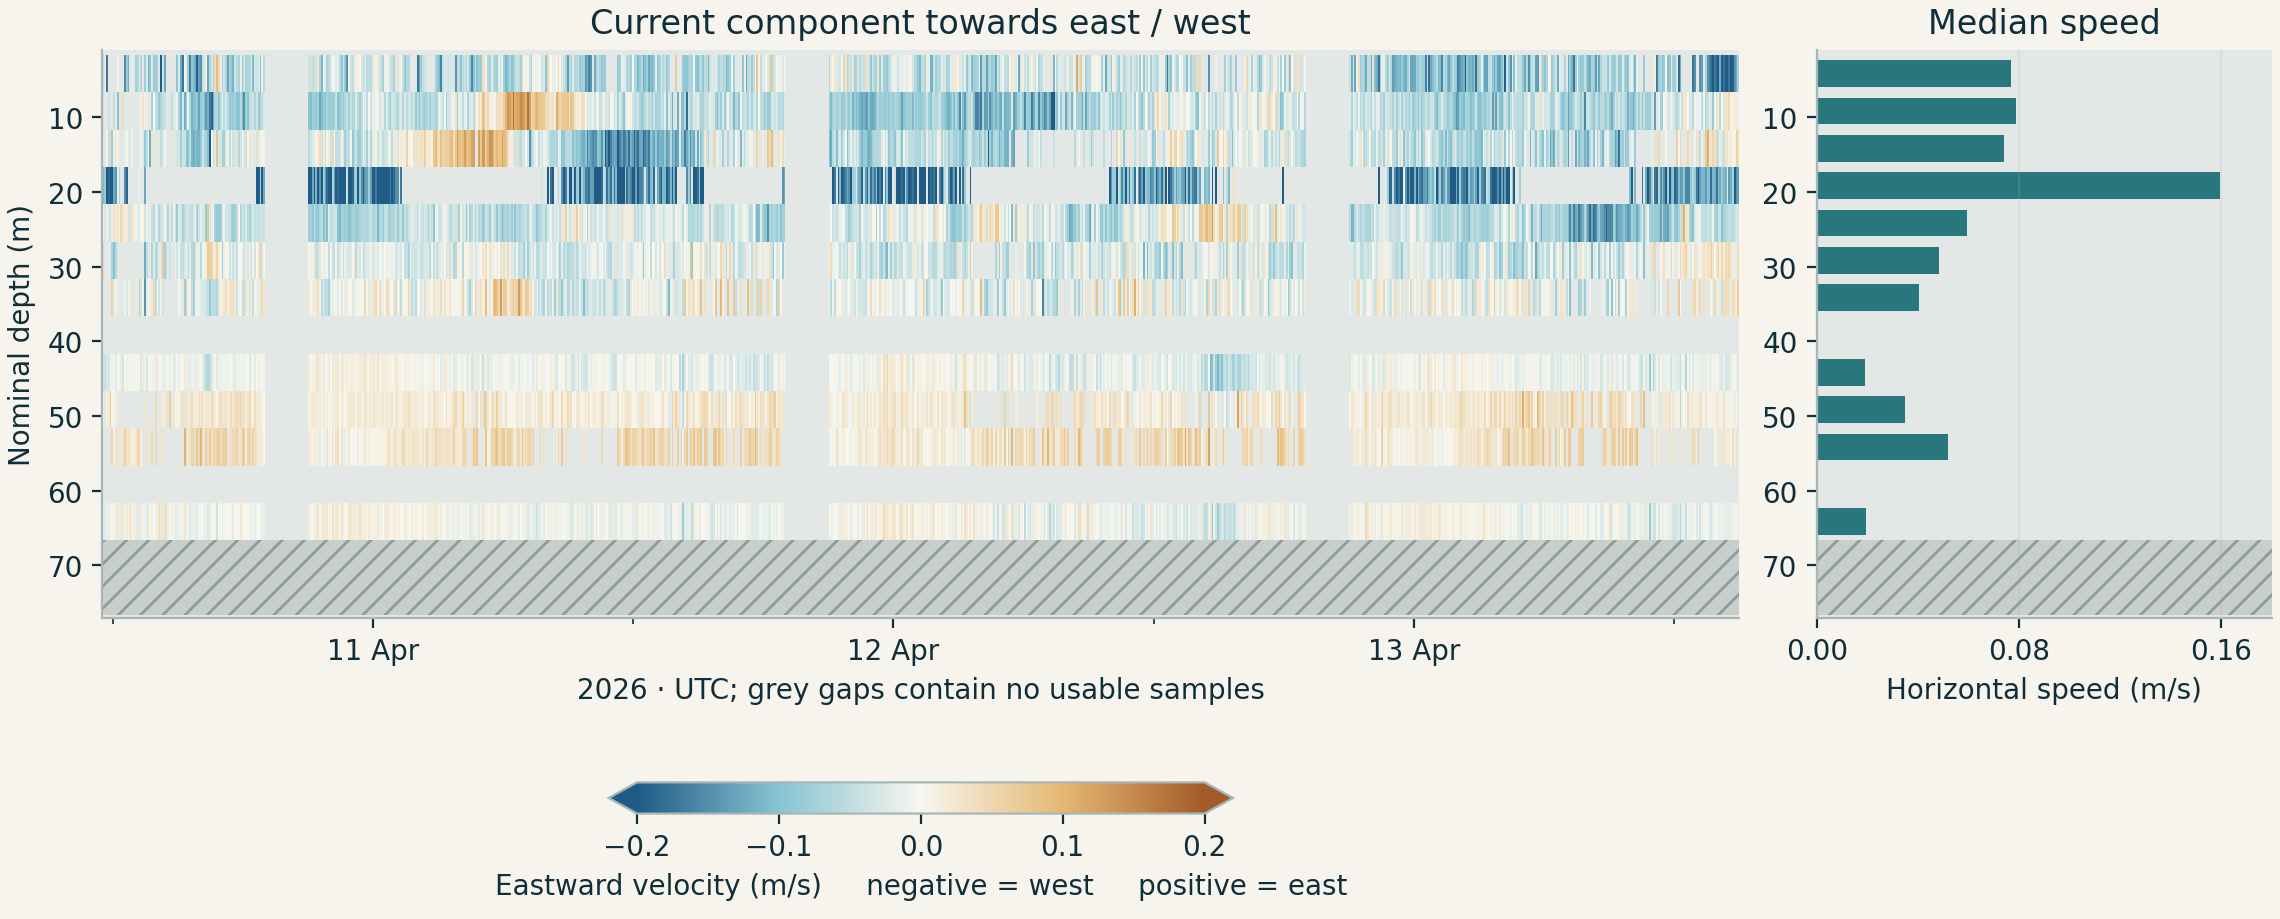
The ADCP measures current velocity from Doppler shifts in echoes from particles moving through the water. The dataset contains 834 five-minute profiles, ending on 13 April at 14:58 UTC, with eastward and northward velocity components in 5 m cells. These show a depth-dependent flow: at the nominal 24.2 m cell, the median horizontal speed was 0.059 m/s, compared with 0.019 m/s at 44.2 m.
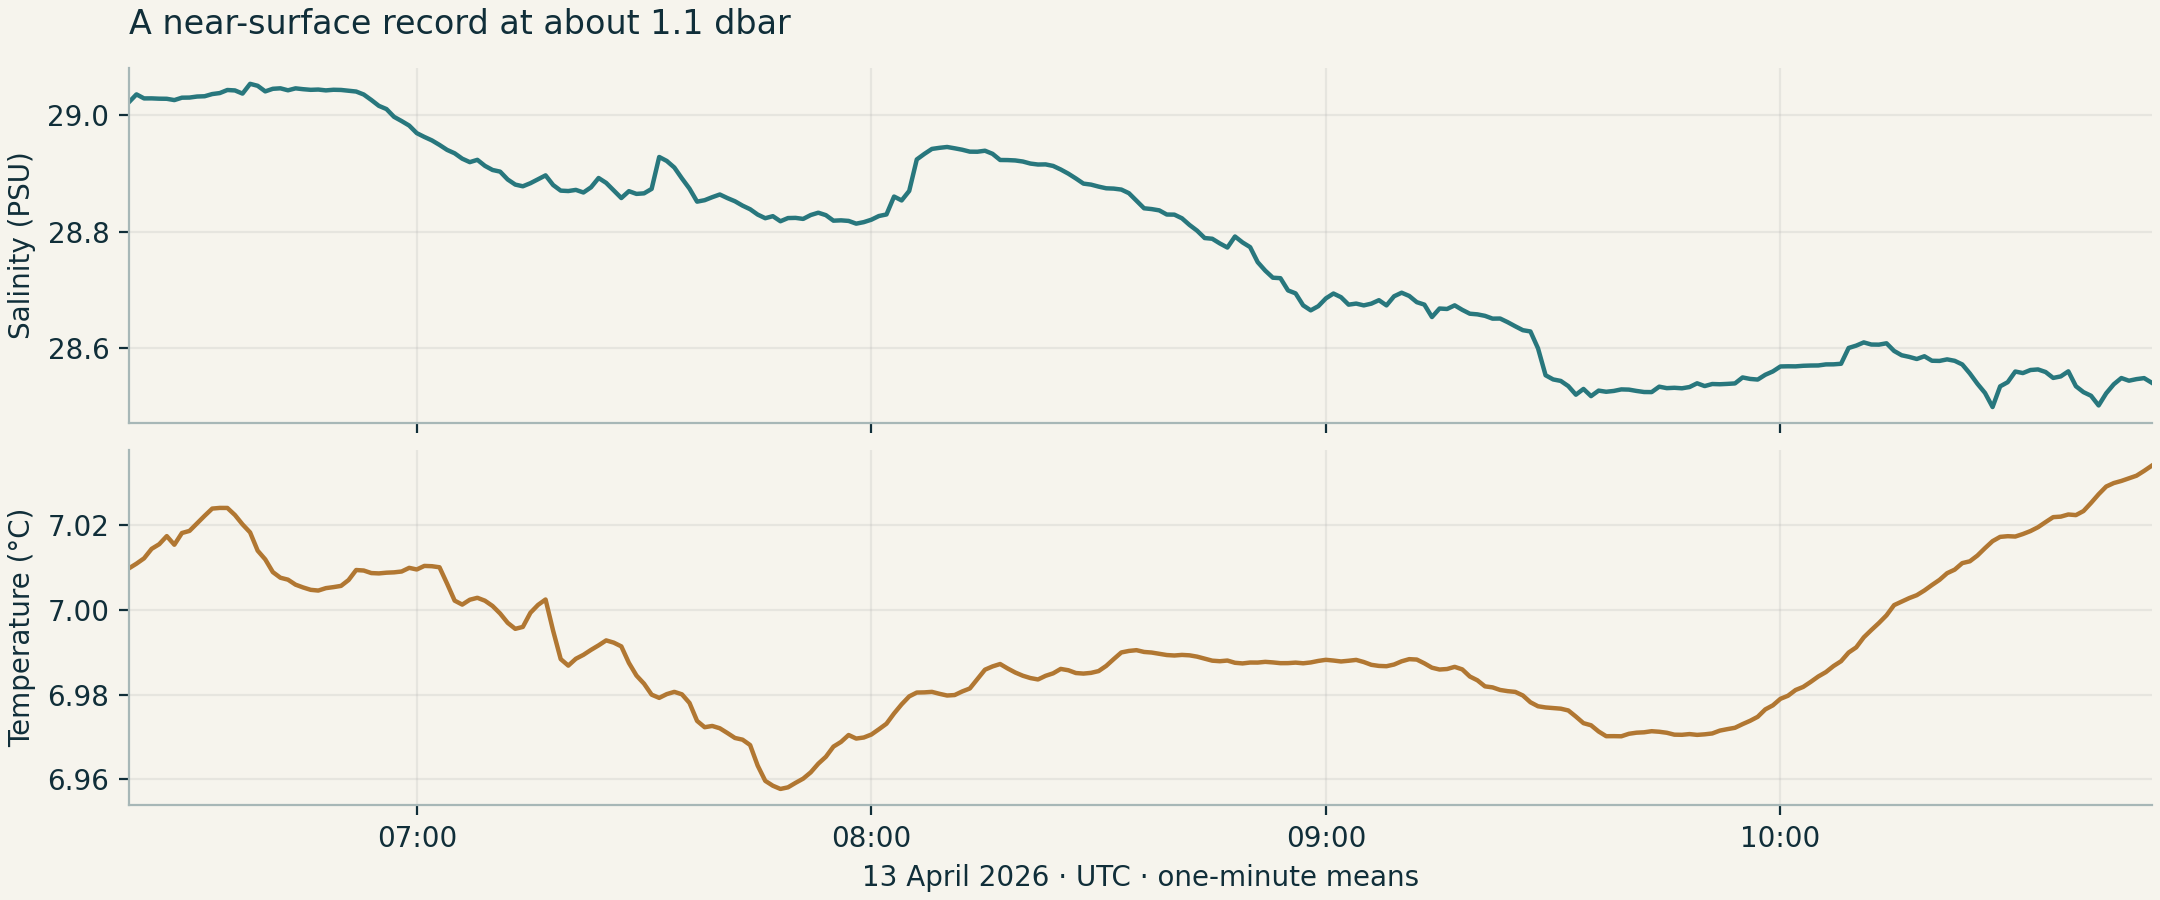
The Sea-Bird SBE19plus CTD contributed its conductivity, temperature and pressure measurements, which describe the water close to the buoy; salinity is derived from those measurements. After processing the data, we can see that between 06:22 and 10:49 UTC on 13 April, salinity fell from 29.02 to 28.54 PSU and across the 268 one-minute means, values ranged from 28.50 to 29.05 PSU. Temperature varied much less, between 6.958 and 7.034 °C.
The chart below shows a general freshening interrupted by shorter fluctuations, while temperature falls and then recovers. The salinity change is consistent with changing mixtures of fresher and saltier water reaching the buoy.
The water measurements are also taken into account for the acoustic data processing. Sound speed controls the conversion from echo travel time to range, while absorption affects the correction for sound lost along its path. We used the ADCP's daily mean temperatures, approximately 6.9–7.1 °C, and a CTD salinity of 28.769 PSU, giving a sound speed near 1472 m/s.
Edge data collection and processing
We also deployed our ruggedised Syslogic RPC RS A4NX (I/O) Edge AI unit, built around an NVIDIA Jetson Orin NX 16 GB module. It ran our containerised processing runtime and algorithms, developed on top of the Azure IoT Edge framework. The device is fanless and has a sealed enclosure with passive cooling and solid-state storage.
The product family carries IP67/IP69 ingress-protection ratings and is designed for shock and vibration, configuration that is well suited for this environment. We were also able to connect remotely via an SSH tunnel, so we could inspect data directly on the device from the office in our JupyterHub workspace.
Conclusion and acknowledgements
The published code, data products and documentation (including the quality issues and gaps in data collection) provide a useful start for other teams to inspect and reuse. Our next step is to test and improve this workflow across longer records and further deployments, and work with observing programmes that need to bring more of their oceanographic data into regular use.
The processed data is uploaded in the EDITO DataLab and a public STAC catalog is available here. The catalogue lists daily data products and links to the whole-deployment record. You can download NetCDF files and CSV tables and echogram images are available alongside Zarr stores for analysis.
The code is MIT-licensed and available on Github at github.com/oceanstreamio/oceanstream-munkholmen. Licence for the data products is CC0 1.0. The 124 GB raw EK80 files are not distributed, but may be available upon request.
This work was funded by Akershus fylkeskommune (AFK) as part of "Digital Solutions for Automated Monitoring of Seaweed Farm Operations." We thank SINTEF Ocean for hosting us at OceanLab, and Ralph Stevenson-Jones and Lukas Frank for their assistance and field work throughout the project. Thanks also to Muriel Dunn and David Aldridge for their support and guidance throughout the project. The EK80 WBT-Mini was loaned by NTNU.